
Most buried relics and historical sites are completely invisible to the naked eye. Even seasoned detectorists sweep past them without a single beep. The difference between a blank field and a site loaded with historical significance often comes down to centimeters of elevation change you'd never notice on foot. Topographic anomaly mapping uses high-resolution elevation data to expose those hidden features before you ever leave home. This guide walks you through the core methods, the science behind them, and a field-ready workflow so your next search targets the highest-probability zones, not just open ground.
Table of Contents
- Understanding topographic anomaly mapping
- The science behind detecting anomalies
- Choosing the right visualization techniques
- From map to field: Verification and common pitfalls
- Workflow: A step-by-step guide for treasure hunters
- A fresh perspective: Mapping as the new edge in treasure hunting
- Ready to elevate your treasure hunting?
- Frequently asked questions
Key Takeaways
| Point | Details |
|---|---|
| Reveal hidden features | Topographic anomaly mapping uncovers terrain changes that signal buried sites others will miss. |
| Science-backed workflow | Combining LiDAR data, advanced visualization, and on-site validation gives you a proven exploration edge. |
| Avoid common pitfalls | Learning to distinguish natural terrain from relics reduces wasted time in the field. |
| Accessible for all | Free tools and public data make advanced mapping techniques available to hobbyists and professionals alike. |
Understanding topographic anomaly mapping
Topographic anomaly mapping is the practice of analyzing elevation data to find subtle terrain features that indicate buried or obscured historical structures. Think of it as reading the landscape in 3D rather than scanning its surface. Where a metal detector reacts to metal underground, topographic mapping reacts to shape. A slight depression might be a collapsed cellar. A low, linear ridge might mark the foundation of a forgotten structure. A faint ring in the earth might outline a burial mound.
The technical backbone of this approach is the Digital Elevation Model (DEM), a grid-based representation of the Earth's surface. DEMs come in several flavors:
- DSM (Digital Surface Model): Captures everything above ground, including trees and buildings.
- DTM (Digital Terrain Model): Filters out vegetation and structures to show bare earth only.
- LRM (Local Relief Model): Subtracts regional topography to isolate micro-scale features.
- LiDAR (Light Detection and Ranging): The laser-scanning technology that generates the ultra-precise point clouds DEMs are built from.
For relic hunting, the DTM and LRM are your most powerful tools. The DTM strips away forest canopy so you can see the bare ground beneath. The LRM then removes the large-scale terrain slope to reveal micro-topographic features, meaning small bumps and dips that would otherwise be hidden by the regional hillside. As archaeological prospection research confirms, LiDAR-derived Local Relief Models detect subtle micro-topographic features indicative of buried historical structures and relics that no surface survey can match.
The real-world scale of this technology is staggering. Projects have prospected over 35,751 km² using these methods, identifying thousands of previously unknown sites. For the individual treasure hunter, that kind of coverage means you can screen an entire county before deciding where to dig. Learn the fundamentals of LiDAR treasure hunting basics to see how this scales to your search area.
Key insight: Traditional metal detecting is reactive. Topographic anomaly mapping is predictive. One tells you what's at your feet; the other tells you where to put your feet in the first place.
Using local relief models explained alongside standard hillshade maps dramatically increases the chances of spotting features that raw DEMs miss entirely.
The science behind detecting anomalies
With the basics covered, it's time to pull back the curtain on the science and workflow that make this possible.
LiDAR aircraft or drones emit millions of laser pulses per second toward the ground. Each pulse bounces back and the sensor records the return time, building a dense point cloud of X, Y, Z coordinates. Software then classifies those points, separating ground-level returns from vegetation and structures, and interpolates them into a smooth elevation grid: your DEM or DTM.
The filtering and normalization step is where the science gets interesting. Raw DEMs show regional topography, a hillside looks like a hillside. To find the small features hidden inside that hillside, analysts apply kernel filtering, essentially subtracting a smoothed version of the terrain from the original. What remains is the local relief anomaly: positive values are mounds or walls rising above local average; negative values are ditches, pits, or depressions sinking below it.
Choosing the right grid resolution matters. A 1-meter resolution grid is ideal for detecting features at the scale of individual walls or burial mounds. Coarser resolutions (5m or 10m) miss details. Finer resolutions generate enormous file sizes with diminishing returns unless you have UAV-collected data over a very small area.
Types of anomalies you can reliably detect include:
- Burial mounds and barrows (positive relief)
- Defensive ditches and moats (negative relief)
- Agricultural terracing and field boundaries
- Ring walls and enclosures
- Collapsed building foundations
| Data Type | What It Shows | Best For |
|---|---|---|
| Raw DEM | Regional topography | Regional overview |
| DTM (bare earth) | Ground surface, no vegetation | Feature detection in forests |
| LRM | Micro-scale relief anomalies | Buried structures, mounds |
| Hillshade | Visual shadow model | Quick anomaly spotting |
Benchmark studies confirm that LiDAR archaeological benchmarks validate detection rates across diverse terrain types. For practical guidance on interpreting your outputs, the section on reading LiDAR data covers the key steps.
Pro Tip: Always work with the DTM, not the DSM, when searching forested areas. The DSM includes tree canopy and will completely obscure the ground features you're hunting for.
Choosing the right visualization techniques
Once your data is filtered, choosing the right visualization can make the difference between a missed opportunity and a major find.
Not all visualizations are created equal, and each one highlights different feature types. Here's what the main options do:
- Hillshade: Simulates sunlight from a fixed direction (typically 315° azimuth, 45° altitude) to cast shadows and reveal relief. Fast to compute but angle-dependent, meaning features parallel to the light source disappear.
- Multi-directional hillshade: Runs hillshade from multiple azimuths and combines them, eliminating the angle-dependency problem.
- Sky View Factor (SVF): Measures how much open sky is visible from each ground point. Depressions appear dark; elevated features appear bright. Excellent for subtle relief.
- Local Dominance: Highlights points that stand above their immediate surroundings. Great for spotting mounds and walls.
- Openness (positive/negative): Positive openness highlights ridges and mounds; negative openness highlights valleys and pits.
The Relief Visualization Toolbox (RVT), developed by the Institute of Archaeology in Ljubljana, offers all of these methods in a free, open-source package. It's the standard tool in both academic and field settings.
| Visualization | Best Feature Type | Weakness |
|---|---|---|
| Hillshade | Walls, linear features | Misses parallel features |
| Multi-dir. Hillshade | General anomalies | Computationally heavier |
| Sky View Factor | Subtle depressions, pits | Can blur sharp edges |
| Local Dominance | Mounds, burial features | Less effective for ditches |
| LRM | All micro-topography | Requires preprocessing |
As LiDAR prospection techniques confirm, multi-directional hillshading significantly reduces angle-dependency compared to standard single-direction methods. The relief visualization methods page offers deeper documentation on each technique.
For treasure hunters integrating these steps into AI-assisted research, the AI-based prospecting workflows guide shows how to layer visualization outputs with historical records for maximum precision.
Pro Tip: Apply at least two different visualization methods to every search area. Features that are faint in hillshade often pop clearly in SVF or LRM. Cross-checking visualizations cuts false positives significantly.
From map to field: Verification and common pitfalls
Armed with maps and the right visualization techniques, let's ensure your next step translates into real finds and not costly mistakes.
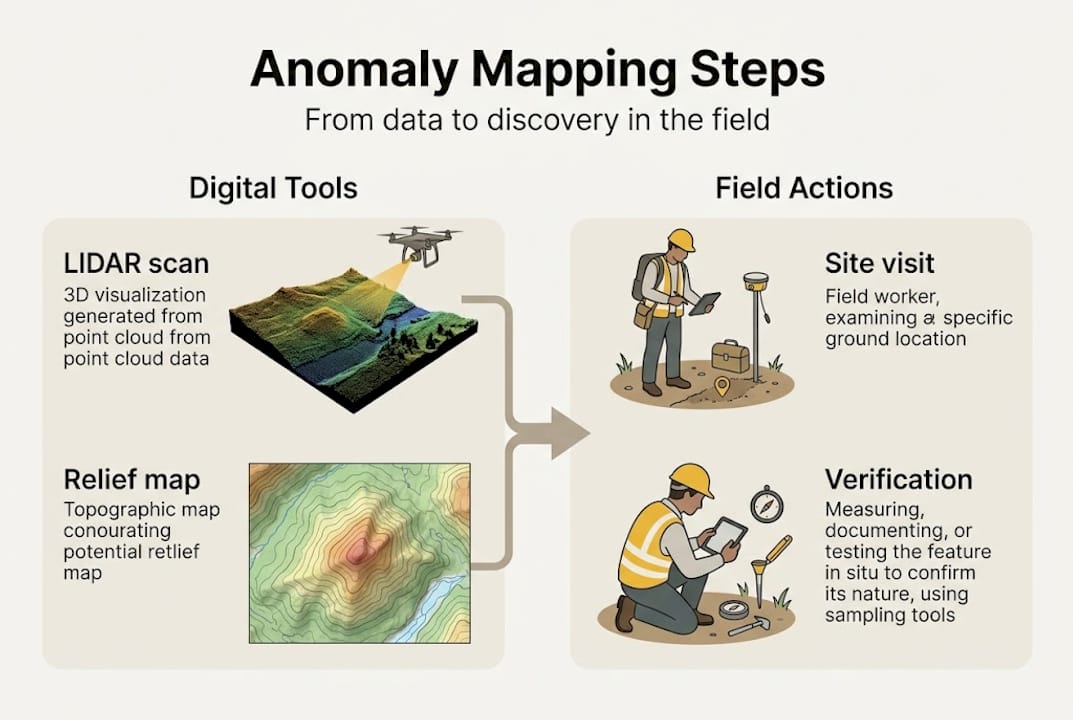
Identifying an anomaly on a map is step one. Interpreting it correctly is step two. Not every dark patch on an LRM is a buried vault. Geometric regularity is your strongest diagnostic tool. Man-made features tend to show straight edges, consistent curves, or repeating patterns. Natural features are irregular, asymmetric, and chaotic.
Ground truthing, meaning an actual site visit, remains non-negotiable before serious detecting work. Walk the anomaly with your eyes and feet first. Feel for subtle changes underfoot. Then sweep with your detector in a controlled grid pattern, logging signal locations before digging anything.
Field reality check: In studies from Epirus, Greece, and Baden-Württemberg, Germany, LiDAR-detected anomalies that appeared archaeologically significant were confirmed through field verification, validating the mapping workflow but also revealing that a meaningful percentage of anomalies had natural explanations.
Common pitfalls that fool even experienced operators include:
- Tree throws: Fallen trees leave root pit and mound pairs that closely mimic archaeological features. The giveaway is their irregular shape and paired depression/mound pattern.
- Erosion gullies: In sloped terrain, erosion channels can look like ditches or linear boundaries.
- Animal burrow networks: Dense burrowing activity creates surface texture that reads as micro-relief on sensitive LRMs.
- LiDAR interpolation artifacts: Sparse point density in canopy gaps creates false features. Always validate with confidence maps to check point density before trusting subtle anomalies.
As UAV LiDAR micro-topography research documents, tree throws and undersampled LiDAR points are the leading sources of false positive anomalies in field projects.
The metal detecting basics guide pairs well here, giving context for integrating detector sweeps with your mapped targets.
Pro Tip: Before visiting any anomaly in the field, download the point density or confidence map for that tile. If the density drops below 4 points per square meter, treat the anomaly with skepticism until you can verify it physically.
Workflow: A step-by-step guide for treasure hunters
With anomalies identified on your screen, here's how to put all the pieces together for next-level search effectiveness.
A practical field-tested workflow for topographic anomaly mapping follows these core steps:
- Access free LiDAR data. The USGS 3D Elevation Program (3DEP) provides 1-meter resolution coverage for most of the continental US. Many states also offer their own portals with even higher-resolution data.
- Download and filter the DTM. Use QGIS, SAGA GIS, or the RVT to clip your area of interest and generate a bare-earth terrain model.
- Apply your visualization stack. Run hillshade, LRM, and SVF at minimum. Overlay them in a GIS environment for side-by-side comparison.
- Identify and catalog geometric anomalies. Draw polygons around candidate features. Note shape, size, orientation, and relief direction (positive or negative).
- Cross-reference with historical data. Compare anomaly locations against historical maps, land records, and aerial photography to build context.
- Conduct a field reconnaissance visit. Walk the site before detecting. Photograph the terrain and note any surface clues.
- Run controlled detector sweeps. Grid the anomaly area systematically. Log every signal with GPS coordinates before excavating.
- Document and verify. Record findings against your map predictions. This builds your personal accuracy database over time.
For archaeological LiDAR case studies that demonstrate these steps at scale, peer-reviewed fieldwork from multiple European projects provides solid benchmarks. The AI-driven search workflow on PinPointTreasure.com automates several of these steps, delivering analyzed coordinates directly to your device.
Pro Tip: Save your anomaly catalog as a georeferenced layer and load it directly onto a GPS device or smartphone app. Navigating to precise coordinates beats eyeballing a printed map in the field every time.
A fresh perspective: Mapping as the new edge in treasure hunting
Stepping back from the technical details, here's why these tools are about more than just data.
The most common objection we hear from experienced detectorists is that LiDAR and DEM analysis feels like academic work, not real treasure hunting. That's a fair reaction. The learning curve is real. But consider what's actually happening when you adopt these methods: you're screening entire landscapes in hours rather than weeks. You're targeting the top 5% of probable sites instead of walking random fields.
Academic sources emphasize LiDAR and DEM analysis for non-invasive archaeological prospection, while the detecting community has traditionally favored ground-penetrating radar and 3D scanners for subsurface voids. These approaches are complementary, not competing. LiDAR wins for surface anomaly detection at landscape scale; GPR wins for confirming subsurface cavities at a single targeted point. Use both.
One particularly instructive case: a detectorist team in southern Germany mapped a 2-kilometer corridor using LRM visualization and identified three geometric anomalies ignored by prior surveys. Two turned out to be natural. One was a collapsed medieval structure containing iron artifacts that multiple previous sweeps had missed entirely. The map didn't replace the detector. It directed it. That's the real value proposition.
For those interested in how historical documents and maps layer with terrain data, the historical cryptic mapping section offers a compelling parallel example of how layered data reveals what single-source analysis misses.
Ready to elevate your treasure hunting?
Topographic anomaly mapping gives you a genuine analytical edge before you ever set foot in the field. The methods covered here, LiDAR filtering, relief visualization, ground truthing, and systematic detecting, work together as a repeatable system.

PinPointTreasure.com was built to make exactly this workflow faster and more accessible. The platform integrates USGS 3DEP LiDAR data with AI-driven analysis, delivering processed anomaly maps and field-ready GPS coordinates without requiring a GIS degree. Whether you're targeting a colonial-era site or a Civil War encampment, explore advanced mapping tools on PinPointTreasure.com to supercharge your next expedition with data-driven precision.
Frequently asked questions
What makes topographic anomaly mapping better than just using a metal detector?
Mapping reveals terrain features that are completely invisible to the naked eye and impossible for a detector to locate without spatial guidance. UAS LiDAR with ML segmentation has detected defensive walls and terracing in Greece that surface surveys entirely missed.
Which free mapping data sources can I use for anomaly mapping?
USGS 3DEP and most state GIS portals offer free LiDAR and DEM downloads at 1-meter or better resolution. Free LiDAR access workflows are well documented for the continental US.
How do I tell if an anomaly is natural or man-made?
Focus on geometric regularity: straight lines, consistent curves, and repeating patterns signal human construction. Geometric regularity in DTMs is the primary diagnostic criterion used by professional archaeologists.
Can these mapping methods help find artifacts under dense vegetation?
Absolutely. LiDAR penetrates forest canopy by capturing ground-level returns from laser pulses that pass through gaps in the foliage. LiDAR under canopy detection is one of the technology's most proven applications.
What tools do I need to start with topographic anomaly mapping?
A standard computer, free LiDAR data from USGS or a state portal, and free software like the Relief Visualization Toolbox are all you need to get started with professional-grade visualizations.
Recommended
- PinPoint Treasure — AI Treasure Hunting, Gold Prospecting & Mystery Solving Platform
- PinPoint Treasure — AI Treasure Hunting, Gold Prospecting & Mystery Solving Platform
- PinPoint Treasure — AI Treasure Hunting, Gold Prospecting & Mystery Solving Platform
- PinPoint Treasure — AI Treasure Hunting, Gold Prospecting & Mystery Solving Platform